I am on the steering committee for the Great Lakes Fishery Commission’s third Sea Lamprey International Symposium, SLIS III. During one of our planning meetings, another member of the committee commented on the citation rate of some of the papers published in the SLIS II proceedings. I thought it would be intersting to look at the number of citations for all the SLIS II papers.
I used Web of Science to get the number of citations. First I looked up a few articles in the proceedings and noticed that their accession numbers all started the same. When I searched for Accession Number = WOS:0002213213*, I got all 60 articles and downloaded their citations (Create Citation Report, Save to Text File, Records 1 to 60) as of 2017-05-26.
Then I wrote a function, read.wos(), to read in Web of Science citation reports, in general, named by default savedrecs.txt.
read.wos <- function(filename) {
  read.csv(filename, skip=4) %>%
  rename(
    Source=Source.Title,
    Year=Publication.Year,
    Page=Beginning.Page,
    Citations=Total.Citations
  ) %>%
  select(
    Authors, Year, Title, Source, Volume, Issue, Supplement, Page, Citations
  )
}
I used the function to read in the citation report for the SLIS II proceedings and added a new variable to the report, theme, corresponding to the subsections of the special issue.
library(tidyverse)
library(DT)

uTheme <- c("Introduction", "Lamprey Biology", "Ecology and Assessment",
  "Alternative Control", "Lampricide Control", "Case Studies",
  "Symposium Reports")

slis2 <- read.wos("savedrecs.txt") %>%
  arrange(Page) %>%
  mutate(
    Theme=factor(uTheme[rep(1:7, c(1, 6, 19, 8, 9, 12, 5))], levels=rev(uTheme))
  ) %>%
  arrange(-Citations)
Other than the introductory article, papers in the lamprey biology theme had the most citations.
ggplot(slis2, aes(reorder(Theme, Citations, median), Citations)) +
  geom_boxplot(fill="lightblue", color="brown", width=0.4,
    outlier.color="white", outlier.size=0) +
  geom_jitter(width = 0.1) +
  ggtitle("Citations of SLIS II Papers, 2003-2017") +
  labs(x="Theme") +
  coord_flip() +
  theme_bw(base_size=14)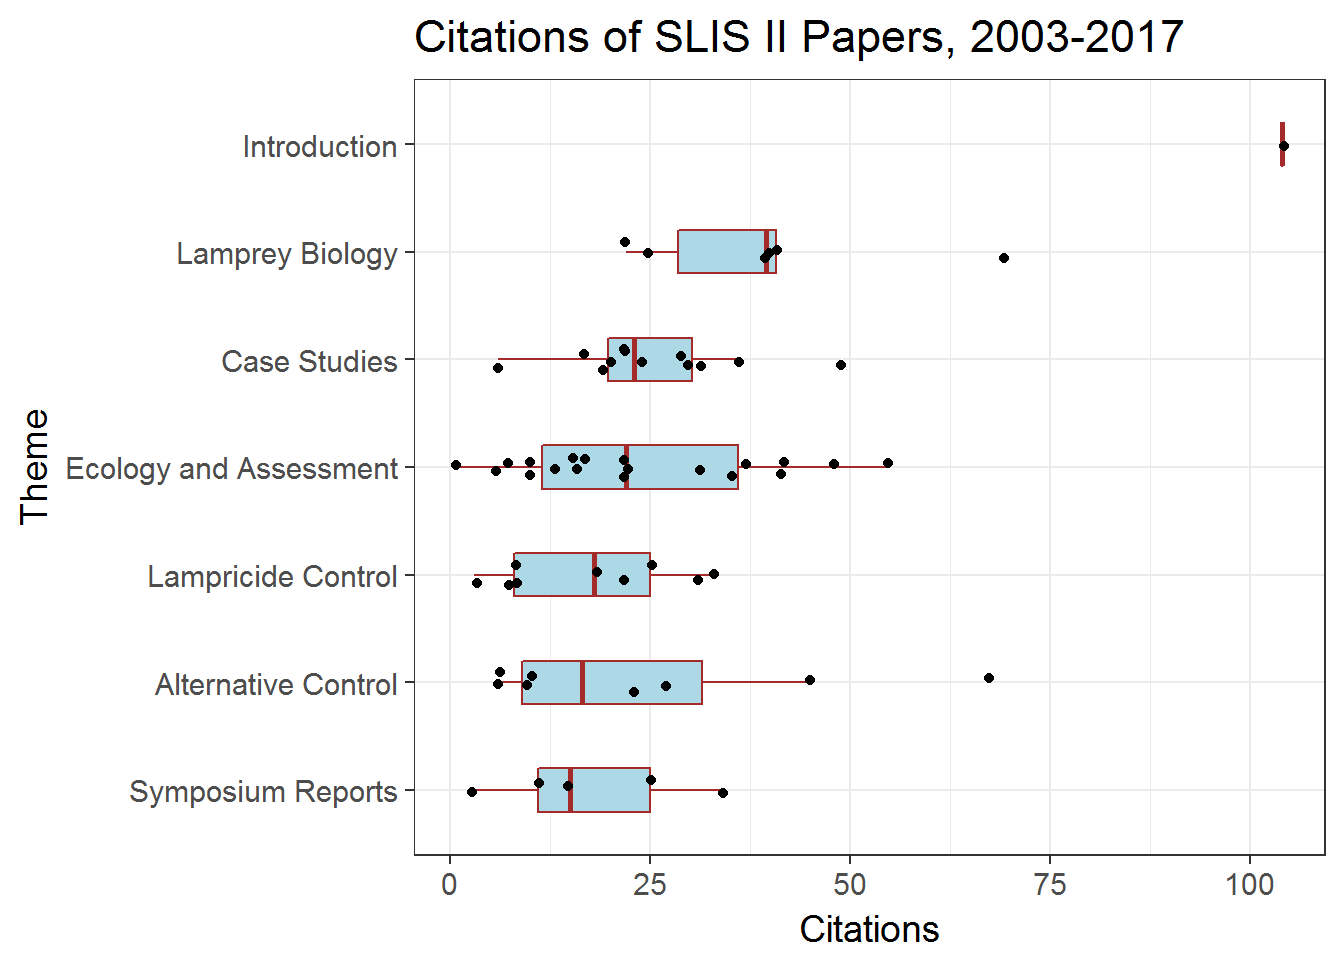
Another member of the committee suggested comparing citation metrics from SLIS II lamprey papers and non-SLIS II lamprey papers. Might there have been an advantage or a disadvantage to scientists publishing their lamprey research in this special supplement? To find out, I went back to Web of Science and downloaded a citation report for all articles with topic = lamprey, year = 2003, and NOT(Accession Number = WOS:0002213213*).
In terms of number of citations, there was no clear advantage nor disadvantage to publishing lamprey research in the SLIS II volume.
other <- read.wos("savedrecs (1).txt")

both <- slis2 %>%
  select(Authors, Title, Citations, Theme) %>%
  bind_rows(other) %>%
  mutate(
    Source = if_else(is.na(Theme), "Other", "SLIS II")
  )

ggplot(both, aes(reorder(Source, Citations, median), Citations)) +
  geom_boxplot(fill="lightblue", color="brown", width=0.4,
    outlier.color="white", outlier.size=0) +
  geom_jitter(width = 0.1) +
  ggtitle("Citations of Lamprey Papers Published in 2003, 2003-2017") +
  labs(x="Source") +
  coord_flip() +
  theme_bw(base_size=14)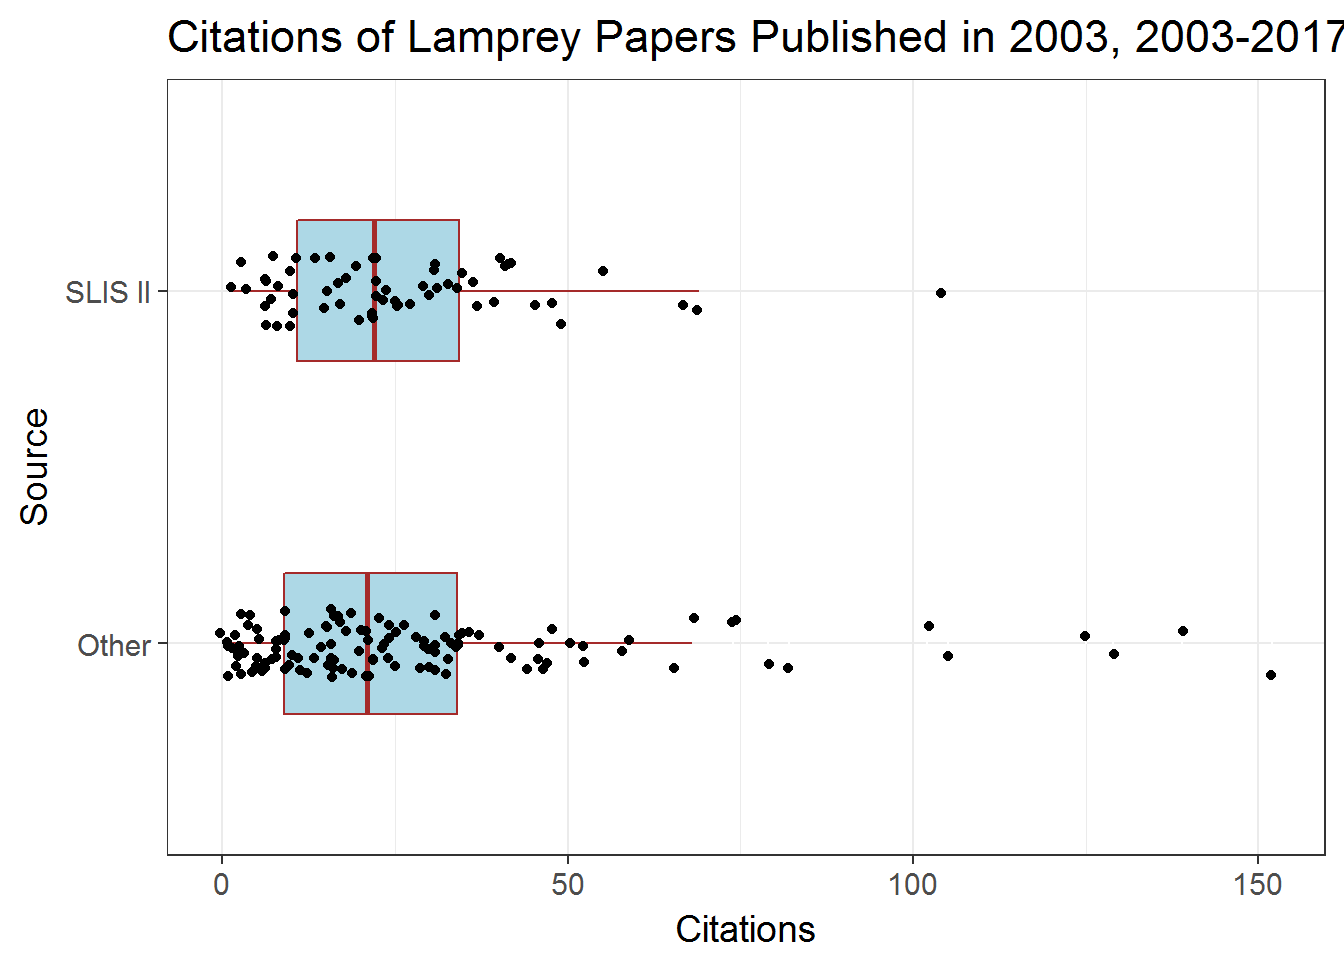
slis2 %>%
  select(Citations, Theme, Authors, Title, Page) %>%
  datatable(
    options=list(pageLength=5),
    rownames=FALSE,
    caption="SLIS II papers, ordered by number of citations, 2003-2017"
  )
other %>%
select(Citations, Authors, Title, Source) %>%
datatable(
options=list(pageLength=5),
rownames=FALSE,
caption="Non-SLIS II papers on lamprey in 2003, ordered by number of citations, 2003-2017"
)2017/06/01
I wanted to follow up with similar information on SLIS I, but Web of Science does not have the proceedings, published in 1980, in their data base.