I was curious about the Wisconsin primary election results. I wanted to see how the votes stacked up among Democrats and Republicans. I also wanted to see how both parties compared to the number of eligible voters that didn’t vote.
I used election results from WisconsinVote.org on 8 Apr. According to Wisconsin’s Government Accountability Board, the State of Wisconsin has 4.44 million eligible voters, of which 3,393,706 were registered by April 1, 2016.
library(DT)
library(RColorBrewer)
library(tidyverse)

dat <- data.frame(
  DemVotes = c(432767L, 567936L, 1765L, 1436L, 0, 0, 0, 0, 0, 0, 0, 0, 0, 0, 0,
    0, 0, 0),
  NoVotes = c(0, 0, 0, 0, 0, 0, 0, 0, 0, 0, 0, 0, 0, 0, 0, 0, 0, 2334973L),
  RepVotes = c(0, 0, 0, 0, 531129L, 155200L, 386370L, 2288L, 3153L, 5608L,
    1310L, 825L, 242L, 1428L, 2491L, 10569L, 510L, 0),
  row.names = c("Hillary Clinton", "Bernie Sanders", "Martin O'Malley",
    "Uninstructed Delegation D", "Ted Cruz", "John Kasich", "Donald J. Trump",
    "Uninstructed Delegation R", "Jeb Bush", "Ben Carson", "Chris Christie",
    "Carly Fiorina", "Jim Gilmore", "Mike Huckabee", "Rand Paul", "Marco Rubio",
    "Rick Santorum", "No Vote")
)
dat <- dat[with(dat, order(-DemVotes, -NoVotes, -RepVotes)), ]


datatable(dat, options=list(pageLength=20),
  caption="Votes in Wisconsin's 2016 Presidential Primary") %>%
  formatCurrency(1:3, currency="", digits=0)
I combined the votes for all candidates that got fewer than 100,000 votes.
cut <- 100000
sel <- apply(dat>cut, 1, any)
oth <- apply(dat[!sel, ], 2, sum)
oth2 <- rbind("Other Rep"=oth, "Other Dem"=oth)
oth2[1, 1] <- 0
oth2[2, 3] <- 0
dat2 <- rbind(dat[sel, ], oth2)
dat2 <- dat2[with(dat2, order(-DemVotes, -NoVotes, -RepVotes)), ]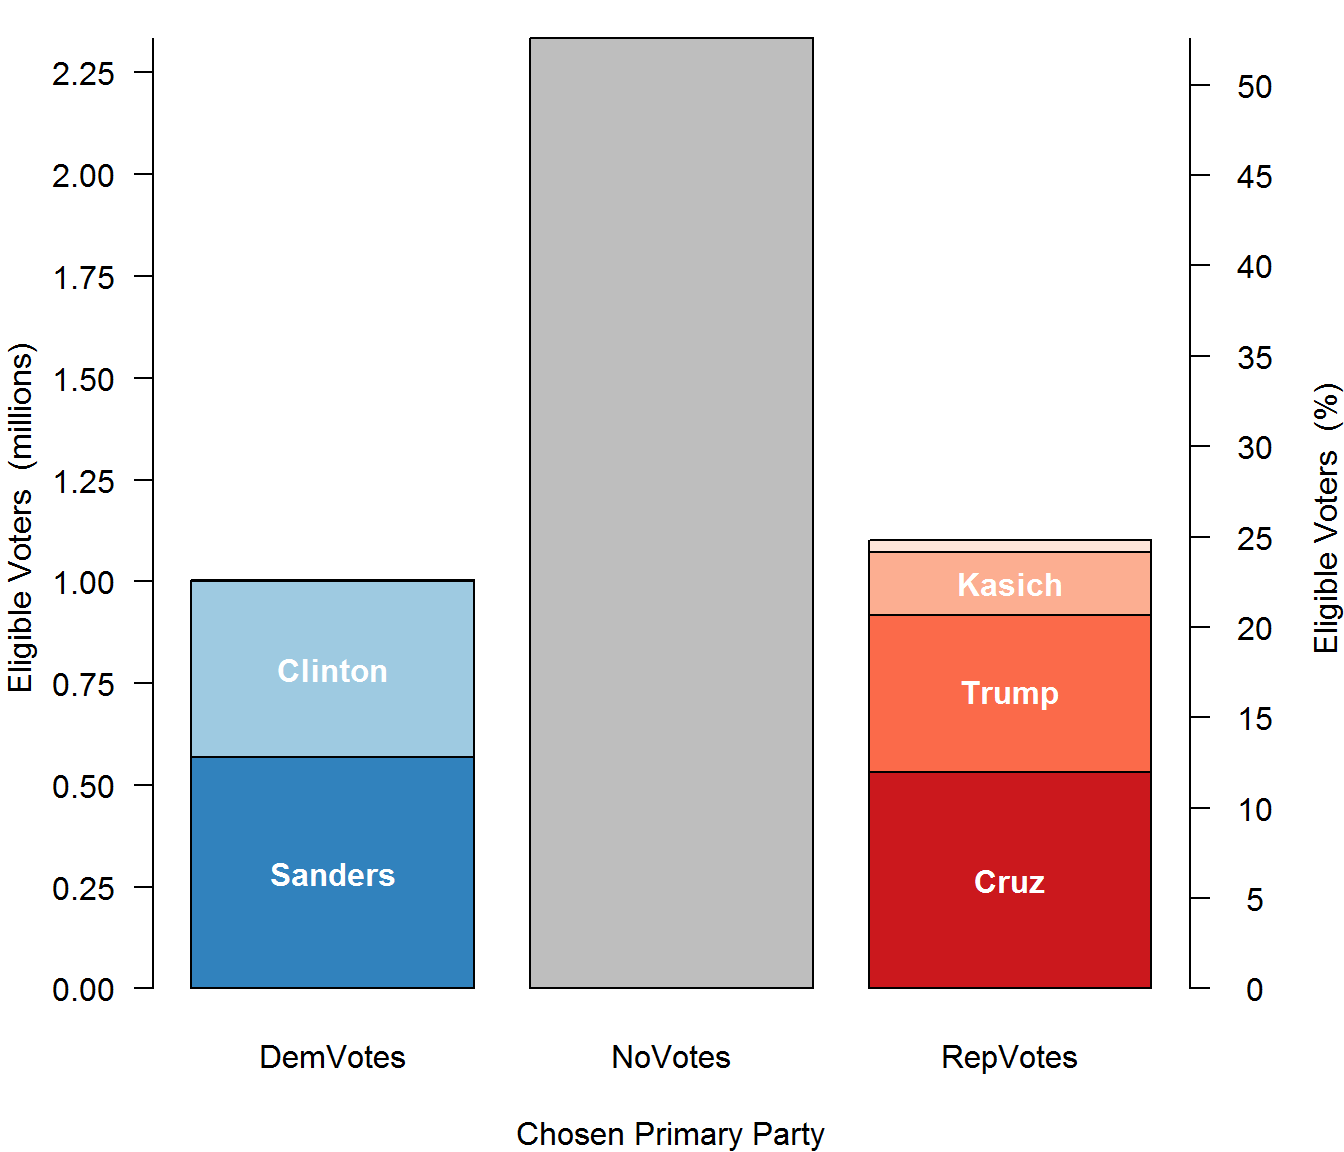
Are we so accustomed to low voter turn out, that we no longer see the elephant in the room - the large number of eligible voters that don’t participate in the elections at all?